#
dataviz
Data visualization is the visual depiction of data through the use of graphs, plots, and informational graphics. Its practitioners use statistics and data science to convey the meaning behind data in ethical and accurate ways.
Here are 523 public repositories matching this topic...
JAEarly
commented
Aug 21, 2018
If the valueField parameter is not set in the config, the documentation specifies that valueField parameter should fall back to 'value'. However, the values are at some point through the plugin. I have created a fix so will make a pull request shortly.
Create charts and diagrams from the command line
chart
charts
csv
dataviz
plots
cpp
graphics
data-visualization
cpp17
plotting
datavisualization
fviz
creating-charts
-
Updated
Jan 29, 2020 - C++
shinkhouse
commented
Jan 30, 2020
Is your feature request related to a problem? Please describe.
I've been unable to successfully implement curveBasis (or any other d3 curve function) with the curve input for ngx-charts-line-chart. There is a real lack of documentation for proper use. When trying to import d3 or d3-shape, I get typescript errors like this:
1
christabor
commented
May 10, 2017
What likely needs to happen:
- Docs moved inside of package (OR linked via setuptools)
- Docs read and imported via python
- Docs then parsed and available on a per-widget basis.
The ultimate goal of the above is so that there is never any disconnect between docs and UI. It should always stay in sync.
skilxn-go
commented
Nov 4, 2019
bug 描述 [详细地描述 bug,让大家都能理解]
设置 info-box 的 Icon 为 font-awesome 图标时不生效。
复现步骤 [清晰描述复现步骤,让别人也能看到问题]
infobox1 := infobox.New().
		SetText("CPU TRAFFIC").
		SetColor("#3583af").
		SetNumber("100").
		SetIcon(`<i class="fa fa-tint" aria-hidden="true"></i>`).
		GetContent()
期望结果 [描述你原本期望看到的结果]
infobox 使用 fa 的图标
实际上最终图标没有,
, the headl
Dex : The Data Explorer -- A data visualization tool written in Java/Groovy/JavaFX capable of powerful ETL and publishing web visualizations.
visualization
datavis
d3
java
groovy
data-science
data-mining
dataviz
javafx
data-visualization
data-analysis
d3js
datavisualization
-
Updated
Feb 12, 2019 - JavaScript
roberrrt-s
commented
Jan 22, 2020
I'm submitting a...
[ ] Regression (a behavior that used to work and stopped working in a new release)
[x] Bug report
PurbashaChatterjee
commented
Aug 14, 2018
Please do not submit support requests or "How to" questions here. For that, go to StackOverflow.
What you were expecting:
What happened instead:
Steps to reproduce:
cjayross
commented
Jan 30, 2020
The links to this library just show a page mentioning that the app had been moved to this project already.
IndrajeetPatil
commented
Dec 31, 2019
For discussion, see IndrajeetPatil/ggstatsplot#333 (comment)
florianporada
commented
Nov 27, 2019
I stumbled upon this repo https://github.com/dataplayer12/homesecurity/ which uses the jetson for CCTV system.
Idea: use a raspberry pi zero with a pi-camera-module could be a simple solution for uses cases like: Hardware inside and camera module outside.
- more secure since the pi only costs a fraction of the jetson
- no cable connection between board and camera
- option to connect more than
Open
CONTRIBUTING.md
2
-
Updated
Mar 14, 2020
Data Explorer by Keen - point-and-click interface for analyzing and visualizing event data.
charts
dataviz
analytics
analysis
web-analytics
data-visualization
data-exploration
keen-io
analytics-api
native-analytics
-
Updated
Mar 2, 2020 - JavaScript
xiallyspider
commented
Jun 6, 2018
v0.3.1 ->leaflet-dvf.js
   _createText: function (layer) {
        // var options = layer.options.text || {};
        var options = layer.options || {};
       ......
        var textNode = document.createTextNode(options.text);
       ......
     }
tomasts248
commented
Nov 30, 2019
For example instead of only listing the name of the property, why not indicating the full line? Instead of "fill" for example for a tooltip, indicate display series.tooltip.background.fill = am4core.color("white");
since classes are different and are not obvious, I have had to google most of them using previous questions and then trying them blindly. Another example: "shiftRadius" is listed but h
https://keen.io/ JavaScript SDKs. Track users and visualise the results. Demo http://keen.github.io/keen-dataviz.js/
visualization
charts
dataviz
analytics
analysis
web-analytics
data-visualization
dashboards
customer-insights
keen-io
analytics-tracking
keen-js
native-analytics
-
Updated
Jun 18, 2019
Data visualizations in Clojure and ClojureScript using Vega and Vega-lite
-
Updated
Mar 20, 2020 - Clojure
christalleras
commented
Jan 19, 2020
Currently TiddlyMap outputs to Png and JSON, but being able to do it in .SVG would be pretty neat as well as an option for some TiddlyWiki projects.
Code, data, and instructions for mapping orbits of asteroids in the solar system
-
Updated
Jul 11, 2019 - Jupyter Notebook
Code, exercises and tutorials of my personal blog ! 📝
python
machine-learning
statistics
dataviz
ai
deep-learning
tensorflow
example
keras
tutorials
pytorch
explainable-ai
-
Updated
Feb 18, 2020 - Jupyter Notebook
RonnyTod
commented
Jun 10, 2019
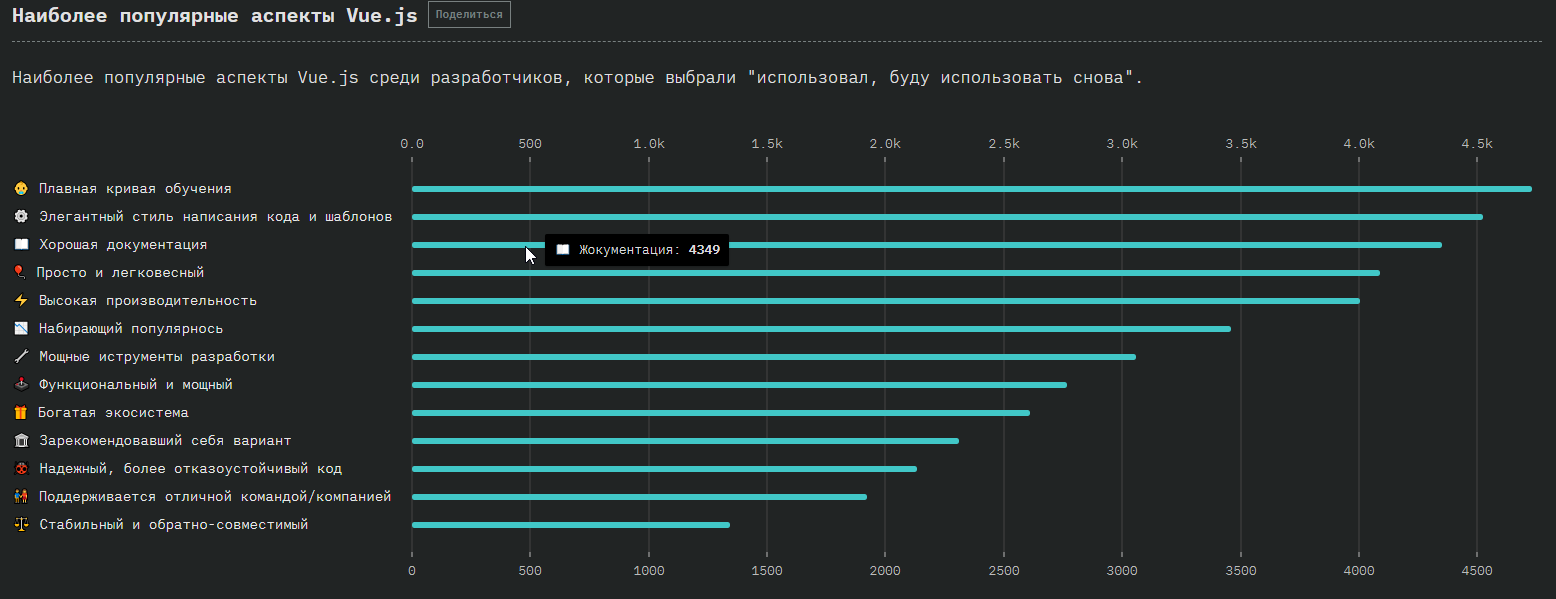
Front-end Frameworks > Vue.js > Most Liked Aspects of Vue.js > Good documentation. On the Russian language when u hover this line u can see "Жокументация" but should be "Документация".
This repository contains the Syncfusion Flutter UI widgets examples and the guide to use them.
-
Updated
Mar 23, 2020 - Dart
Created by Charles Joseph Minard
- Wikipedia
- Wikipedia
Network component seem to be poorly documented on how to use with Layers, as well as interactivity. My immediate desire is to be able to show some information about a node on hover (or always), such as a label. I can't seem to find anything about this anywhere, and it seems to be a very common use case for this type of data visualization. There isn't much to learn from an unlabeled graph.
Ideal